Data Analysis
Modern CSV has several tools for analyzing files:
Statistics
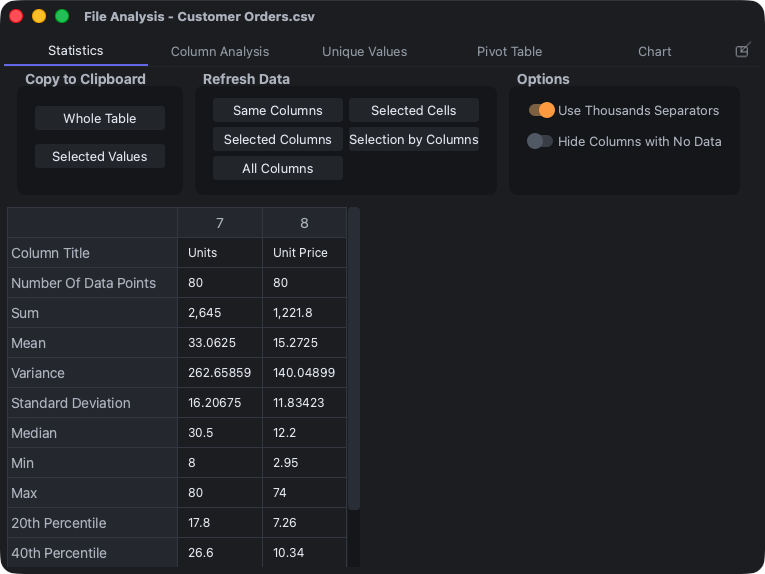
Statistics - All Columns
Statistics - Selected Cells
Statistics - Selected Cells by Columns
Statistics - Selected Columns
If your file contains numerical data, the Statistics tab will compute basic statistical measures. This includes:
- Number Of Data Points
- Sum
- Mean
- Variance
- Standard Deviation
- Median
- Min
- Max
- 20th Percentile
- 40th Percentile
- 60th Percentile
- 80th Percentile
Note that variance and standard deviations are biased.
The Statistics - Selected Cells command operates on all selected cells containing numerical values regardless of which column they're in. The Statistics - Selected Cells by Columns command segregates the selected cells by column and evaluates them.
Buttons
You can copy part or all of the results to the clipboard using the Whole Table or Selected Values buttons.
The measures will not update automatically if the underlying data is changed. You can tell it to update the same columns that you originally had it analyze with the Same Columns button. If you want it to update new columns, you can select them and click the Selected Columns button. If you want to analyze all columns, select the All Columns button.
Column Analysis
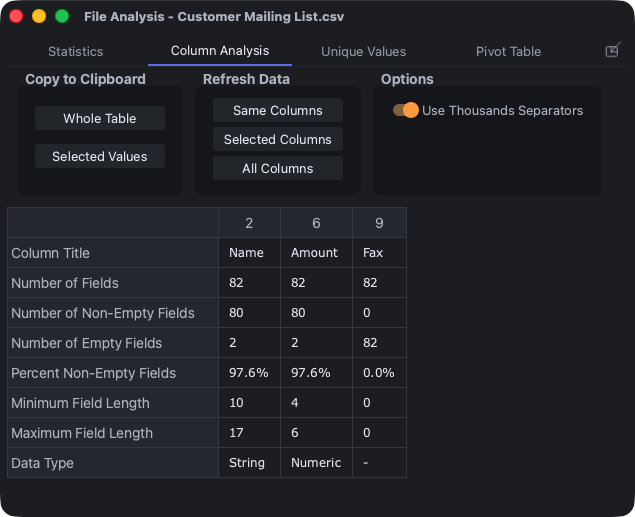
Column Analysis - All Columns
Column Analysis - Selected Columns
The Column Analysis tab gives you the following information about each column:
- Number of Fields
- Number of Non-Empty Fields
- Number of Empty Fields
- Percent Non-Empty Fields
- Minimum Field Length
- Maximum Field Length
- Data Type (String, Number, or Date)
Dates can be in virtually any format and it will detect them.
Buttons
You can also copy part or all of the results to the clipboard using the Whole Table or Selected Values buttons.
Like the Statistics tab, these values will not update automatically if the underlying data is changed. You can tell it to update the same columns that you originally had it analyze with the Same Columns button. If you want it to update new columns, you can select them and click the Selected Columns button. If you want to analyze all columns, select the All Columns button.
Unique Values
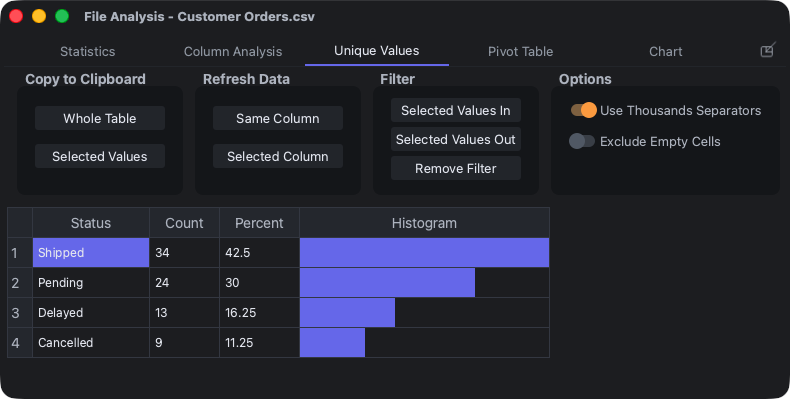
Unique Values - Selected Column
The Unique Values tab tells you how many times each distinct value appears and the percentage of entries it occupies. You can analyze one selected column or multiple selected columns. It also provides a histogram to compare counts.
It can also be used to pick distinct values to filter. You can either filter them in (i.e. view only rows with selected values) or filter them out (i.e. view all rows except those with the selected values).
Buttons
You can copy part or all of the results to the clipboard using the Whole Table or Selected Values buttons.
Like the other two tabs, the values will not update automatically if the underlying data is changed. You can tell it to update the data with the Same Column button. If you want data on different columns, select them in the main window and click the Selected Column button.
To filter values, select whichever value or values you want (it doesn't have to be the value column. You can select the Count or Percent column). Click the Selected Values In or Selected Values Out button to filter the values in or out.
Pivot Table
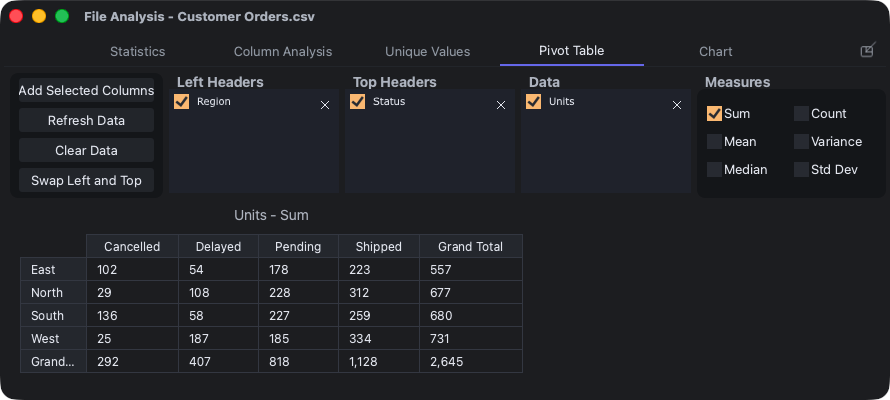
Pivot Table - Selected Columns
The Pivot Table shows statistics on groups of data. For instance, if you have sales data for salesmen grouped into regions North, East, South, and West, the Pivot Table can show you the grand total for each region or the average of each salesman in each region.
You'll need to provide it two types of data - headers and data. The headers are the groups (e.g. North, East, South, and West) and the data are numerical values to operate on (e.g. sales figures). There is no limit to how many header columns or data columns you can use. Header columns can go on the left of the pivot table or along the top. You can place header columns on the left axis or along the top and order them however you want.
Grand totals can be shown for the left axis, top axis, or both.
To use it, select columns representing both the headers and the data and call the Pivot Table - Selected Columns command. It will place all non-numerical data in the Left Headers list and all numerical data in the Data list. You're free to move them around as you wish by simply dragging and dropping. For instance, if there's a year column, it'll start in the Data list, but you'll probably want it to be under one of the Header lists.
You can select as many statistical measures as you like. The options are:
- Sum
- Mean
- Median
- Count
- Variance
- Standard Deviation
If you want to remove a column from the Left Headers, Top Headers, or Data lists, click on the X symbol to the right. If you want to temporarily hide it, uncheck the box to the left.
Buttons
If you want to pull more columns into the Pivot Table, select them on the original file and then click the Add Selected Columns button. If the underlying data is changed, you can update the tables with the Refresh Data button. To remove all columns, click the Clear Data button. If you want to transpose the table, the Swap Left and Top button will do that.
If you want to copy an entire table to the clipboard, including headers and data, right click and select the Copy Entire Table option. You can also copy individual values.
Charts
Chart - Selected Columns
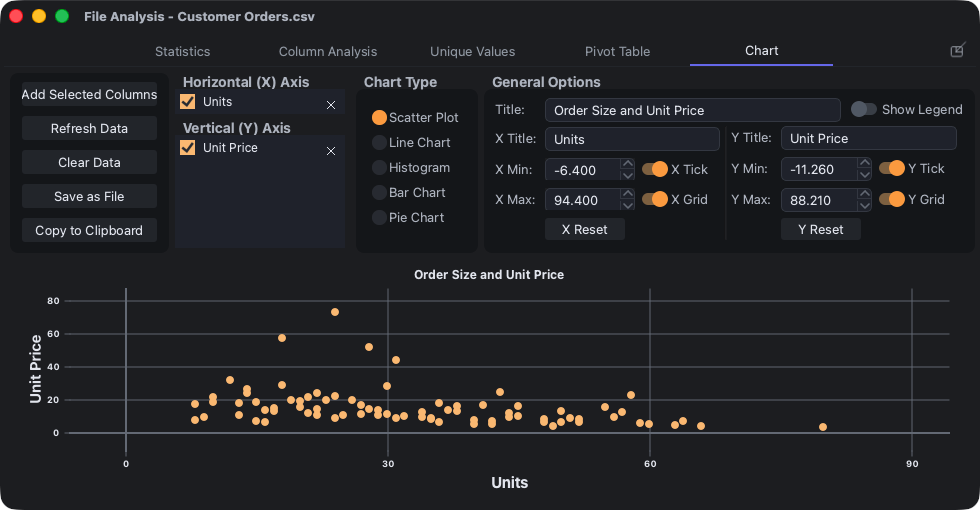
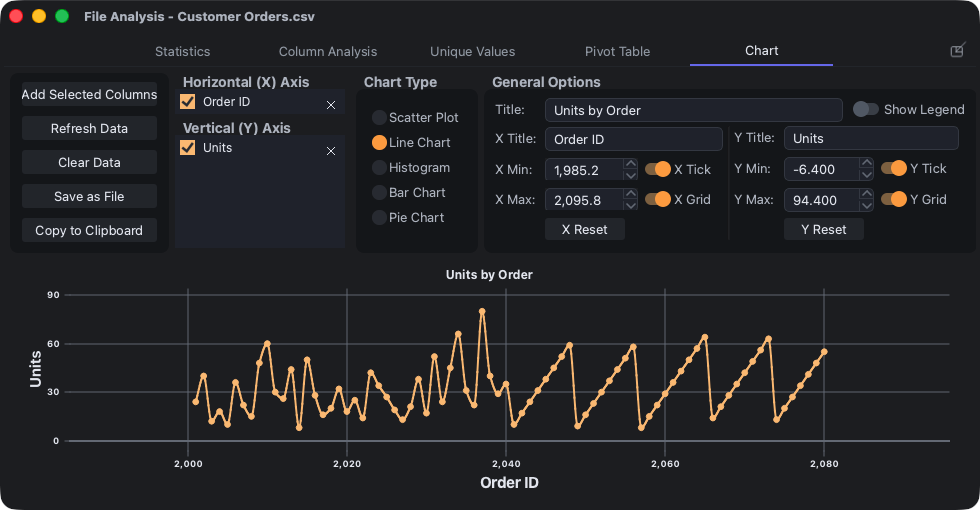

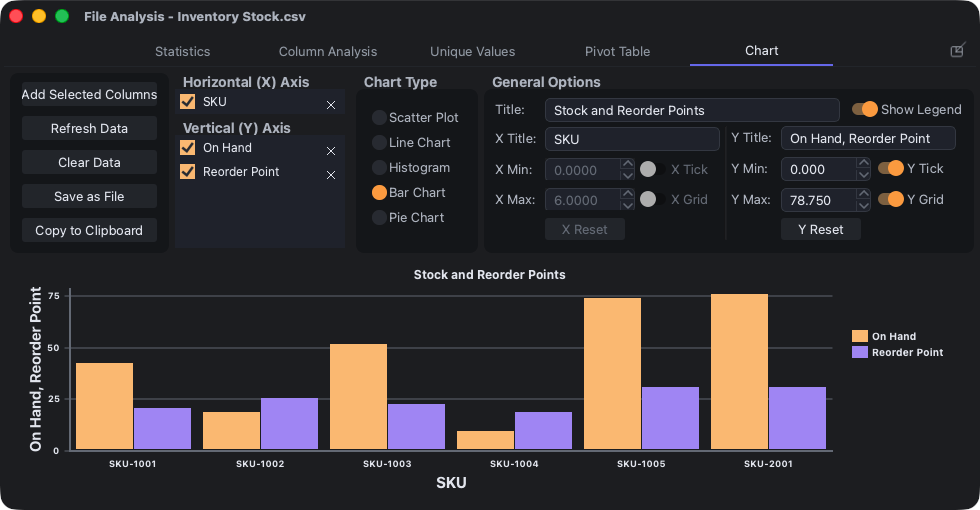

Scatter Chart - Selected Columns
Line Chart - Selected Columns
Histogram Chart - Selected Columns
Bar Chart - Selected Columns
Pie Chart - Selected Columns
Select the columns you want to chart, then call one of the chart commands. The Chart - Selected Columns command will guess what kind of chart you want based on the data. The other commands will generate a specific chart type.
Number Format and Date Ordering affect how values are parsed for charts.
Most of the chart types require a single X-axis dataset (or column) and at least one Y-axis dataset. Here are the requirements by chart type:
| Chart Type | X-Axis | Y-Axis |
|---|---|---|
| Scatter Plot | 1 numerical required | 1 or more required |
| Line Chart | 1 numerical optional | 1 or more required |
| Histogram | - | 1 or more required |
| Bar Chart | 1 non-numerical optional | 1 or more required |
| Pie Chart | 1 non-numerical required | 1 or more required |
You can drag and drop datasets between X and Y axes or change their order.
In the General Options section, you can set the chart title, axis titles, axis tick marks, axis gridlines, and whether or not to show a legend.
On the right side, there are chart-specific options such as showing regression lines, setting the number of bins for histograms, or labelling slices for pie charts.
Zooming
You can zoom in and out of the data with all chart types except pie charts. There are several ways to zoom:
- Mouse wheel
- Select a range with the mouse
- Double-click the mouse (bring to default zoom)
- Manually setting the axis min and max values
Mouse wheel
If you simply rotate the mouse wheel, it will zoom in or out on both axes. If you hold down the Alt key while scrolling, it will only zoom on the X axis. If you hold down the Shift key while scrolling, it will only zoom on the Y axis. These are easy to remember because on most keyboards, the Alt key is on the bottom (like the X axis) and the Shift key is on the side (like the Y axis).
Select a range with the mouse
If you hold down the Ctrl key, you can click the mouse and drag it over an area. As soon as you let go, it will zoom to that area.
If you hold down Ctrl and Alt at the same time, it will zoom only along the X axis. If you hold down Ctrl and Shift at the same time, it will zoom only along the Y axis.
Double-clicking the mouse to go back to the default zoom and manually setting the axis min/max values are self-explanatory.
Moving the chart
When zoomed in, you can move the chart by clicking and dragging it. If you hold down the Alt key while doing so, it will only move along the X axis. If you hold the Shift key, it will only move along the Y axis.
Inspecting chart values
If you move the mouse over a chart value and press the middle mouse button, it will show the values of the data points near the mouse.
Chart-specific options
Scatter Plot

- Line: A linear regression line through each dataset.
- Equation and R^2: The equation in the form of
y = mx + bfor the linear regression line. Also, the coefficient of determination. Will display with the legend. - R: Correlation coefficient. Will display with the legend.
Line Chart
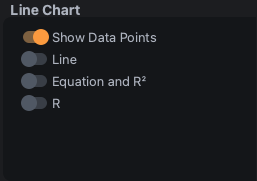
- Show Data Points: Shows dots where the data is. This feature is only enabled if the point density is not too high.
- Line: Same as Scatter Plot.
- Equation and R^2: Same as Scatter Plot.
- R: Same as Scatter Plot.
Histogram
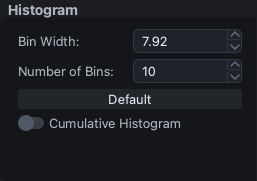
- Bin Width: The width of each histogram bin. Number of bins will automatically change as this is changed.
- Number of Bins: The number of histogram bins. Bin width will automatically change as this is changed. Limit is 1,000.
- Default: Go back to the default bin setting which is 10 histogram bins.
- Cumulative Histogram: For each bin, display the frequency of samples falling into that bin or lower bins.
Bar Chart
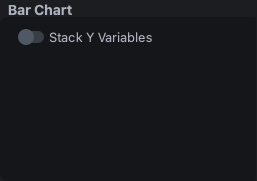
- Stack Y Variables: If there are multiple Y Axis datasets, it will show them stacked in single column rather than adjacent to each other. This is useful for seeing the total size of each category and how much each dataset (or column) contributes to it.
Pie Chart
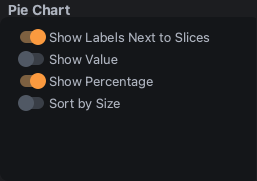
The following are self-explanatory:
- Show Labels Next to Slices
- Show Value
- Show Percentage
- Sort by Sizes
Buttons
On the left side, there are the following buttons:
- Add Selected Columns
- Refresh Data
- Clear Data
- Save as File
- Copy to Clipboard
Add Selected Columns will add the table's selected column to the Y axis datasets. If one should be in the X axis, you can drag it there.
Refresh Data can be used in the case that the underlying data changes and you want the chart to reflect the change. The chart does not automatically update as the data changes.
Clear Data gets rid of the datasets in the X and Y axis column lists. Any charts will be removed.
Save as File opens a separate window with options to save the chart to a file. The supported formats are:
- PNG
- JPEG
- BMP
- TIFF
- WEBP
- ICO
- SVG
Each one will show a preview on the left side and format-specific options on the right side.
In addition to format-specific options (e.g. resolution, compression level, DPI, etc.), you can set the colors of the background, text, and plots.
Copy to Clipboard opens a separate window with options to clip to the clipboard. It's similar to Save as File. The format options are:
- PNG
- JPEG
- BMP